
Top 10 customer satisfaction metrics to monitor for your ecommerce store in 2024


Let's face it: Ecommerce has never been more relevant than today and therefore, the significance of customer satisfaction has never been more pronounced. With the digital transformation of commerce, relentless competition for user attention, and the rise of consumer expectations, customer satisfaction is not just a key metric but a pivotal determinant of a business's longevity and prosperity.
A Zendesk report revealed that as many as 70% of customers spend more money with businesses that offer fluid, personalized, and exceptional customer experiences. This highlights a broader market trend where customer satisfaction is a central strategic objective.
By monitoring customer satisfaction metrics and leveraging data on customer experience, businesses can anticipate customer needs, crafting experiences that resonate deeply with their target audience. This proactive approach to customer satisfaction fosters loyalty and propels business growth, as satisfied and happy customers are more likely to become repeat clients and brand advocates.
The customer satisfaction landscape in 2024
The digital era has ushered in a new paradigm where customer interactions are no longer linear but occur across multiple platforms and channels. As a result, customers now expect a degree of personalization and efficiency that was unthinkable just a few years ago.
This shift is evident in several key trends.
Omnichannel experience
Consumers expect a seamless experience across all channels, whether they're shopping online, in-store, or through a mobile app. The boundaries between physical and digital channels have blurred, creating a need for consistent and integrated customer experiences.
Personalization at scale
Advanced data analytics and AI have enabled businesses to offer hyper-personalized experiences. From personalized product recommendations to individualized marketing messages, the expectation for tailored experiences is at an all-time high.
Real-time customer support
With the advent of chatbots and AI-driven support tools, customers now anticipate immediate responses to their inquiries and issues, regardless of the time of day.
Proactive engagement
Customers value businesses that anticipate their needs and preferences. Proactive engagement, such as notifying customers of relevant promotions or reminding them of items left in their cart, has become a standard expectation.
The impact of emerging technologies
Technological advancements have been the primary catalysts in reshaping customer satisfaction metrics. The integration of AI and machine learning has not only raised customer expectations but also provided businesses with the tools to meet these heightened demands.
AI and ML
AI and ML are at the forefront of analyzing customer data and predicting future behavior. They enable businesses to understand customer preferences and deliver more relevant, personalized experiences.
Automation
Automation tools have revolutionized customer service, enabling faster and more efficient resolution of issues and queries. This shift towards automation has raised customer expectations for swift service.
AR, VR, IoT, voice and conversational interfaces
Finally, VR and AR technologies, the Internet of Things, as well as voice assistants and conversational interfaces have transformed the shopping experience. These technologies offer customers engaging, interactive, and personalized experiences, resulting in better user satisfaction.
Now let’s focus on the ten client satisfaction metrics you should religiously monitor in 2024.
Customer Effort Score (CES)
This is a critical metric in assessing how much effort a customer has to exert to interact with a business.
This could involve:
- Resolving an issue
- Fulfilling a request
- Purchasing a product
- Availing a service
Customer effort score is pivotal because it directly correlates with customer satisfaction and loyalty. A lower CES typically indicates that customers find it easier to interact with a company, leading to higher satisfaction and an increased likelihood of repeat business.
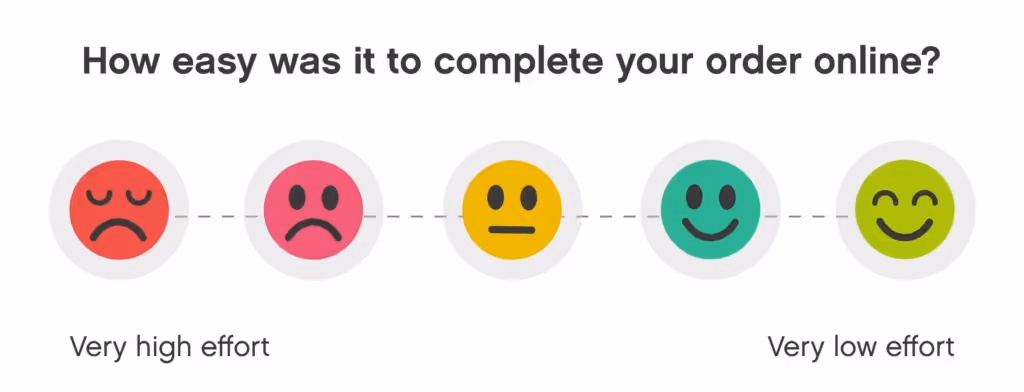
Measuring CES
To effectively measure customer effort score, companies usually deploy post-interaction surveys asking customers to rate the ease of their experience. The question might be phrased as "On a scale of ‘very easy’ to ‘very difficult’, how easy was it to interact with our company?”
The responses help businesses identify pain points in customer interactions and streamline processes accordingly. Advanced customer effort score measurement may involve segmenting responses by interaction type or customer demographic to gain more nuanced customer insights.
Net Promoter Score (NPS)

NPS is a widely used metric for assessing customer loyalty. It is based on the fundamental question "On a scale of 1 to 10, how likely are you to recommend our company/product to a friend or colleague?" This simple query provides profound insights into customer satisfaction levels and brand loyalty.
Calculating and implementing NPS
It is calculated by subtracting the percentage of detractors (customers who respond with a score of 0-6) from the percentage of promoters (customers who respond with a 9 or 10). Scores of 7 and 8 are considered passives and do not directly impact the net promoter score NPS. A high net promoter score indicates strong customer loyalty and satisfaction, while a low NPS signals areas for improvement.
Integrating net promoter score into ecommerce strategies involves:
- Using customer feedback to enhance service quality
- Segmenting customers based on their loyalty
- Tailoring marketing strategies accordingly
For instance, promoters can be targeted with referral programs, while detractors' feedback can be used to improve products and services.
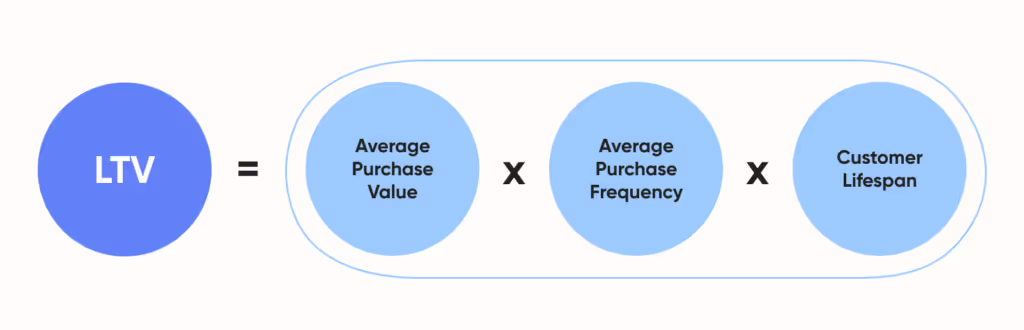
Customer Lifetime Value (CLV)
Customer lifetime value is a projection of the total value a business can derive from its entire relationship with a customer. This customer satisfaction metric underscores the long-term importance of maintaining and nurturing customer relationships, as opposed to focusing solely on short-term transactions.
Calculating customer lifetime value in an ecommerce context involves analyzing a customer's purchase history, engagement patterns, and other behavioral data. This analysis helps predict the future value of a customer, enabling more strategic allocation of marketing and customer service resources.
Improving CLV
To enhance the average customer lifespan, businesses can employ personalized marketing strategies that cater to the individual preferences and needs of customers. Implementing loyalty programs that reward repeat purchases can also significantly boost CLV.
Additionally, providing exceptional customer service at every touchpoint ensures a positive customer experience, encouraging a longer and more profitable customer relationship. Success stories in increasing CLV often highlight a significant boost in repeat customers, higher average order values, and increased overall revenue.
Abandonment rate
The abandonment rate measures the percentage of customers who start but don’t complete a desired action, such as a purchase or a customer service interaction. The metric is particularly relevant in ecommerce (cart/checkout abandonment) and situations with customer support teams.
A lower abandonment rate often results in increased sales and better customer engagement. Understanding and improving this metric can lead to more effective customer journey mapping and process optimization.
To reduce the abandonment rate, businesses need to analyze the points at which customers disengage and address underlying issues. This might involve streamlining the checkout process, improving website loading times, or enhancing the clarity of communication during customer service interactions.
Average Order Value (AOV)
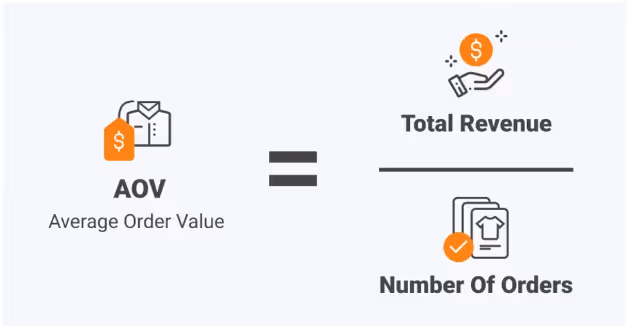
This metric is used to measure customer satisfaction by considering the average amount of money each customer spends per transaction. It provides valuable insights into customer purchasing behavior and the effectiveness of pricing and marketing strategies.
A higher AOV has a significant impact on the bottom line of a business. It suggests that customers are buying more products or higher-priced items per purchase, which can be indicative of effective cross-selling, upselling, or customer loyalty.
By increasing the average purchase spending per customer, companies can boost their revenue without necessarily increasing the number of customers. This is particularly important in competitive markets where acquiring new customers can be costly.
Increasing AOV
To increase AOV, businesses can employ various strategies:
- Upselling involves encouraging customers to purchase a higher-end version of the product they're interested in.
- Cross-selling suggests additional products that complement the initial purchase.
- Providing incentives for larger purchases, such as volume discounts or free shipping on orders over a certain amount, can also encourage customers to spend more.
- Another effective tactic is creating product bundles at a discounted rate compared to buying items separately.
First contact resolution (+ average time per request)
First contact resolution measures the efficiency and effectiveness of a business's customer service team by tracking the percentage of customer inquiries or issues resolved on the first interaction with the company. Alongside this, the average time per request metric quantifies the average duration taken to address and resolve a customer's request or issue.
A higher FCR and a lower average time per request directly correlate with increased customer satisfaction and efficiency in operations. Efficient resolution of customer issues enhances the company's reputation and can lead to higher customer retention rates.
How to improve these customer experience metrics?
Improving FCR and reducing the average time per request requires a combination of well-trained customer service personnel, efficient processes, and supportive technology. Streamlining customer service procedures, implementing effective CRM systems, and providing comprehensive training can significantly enhance these customer satisfaction metrics.
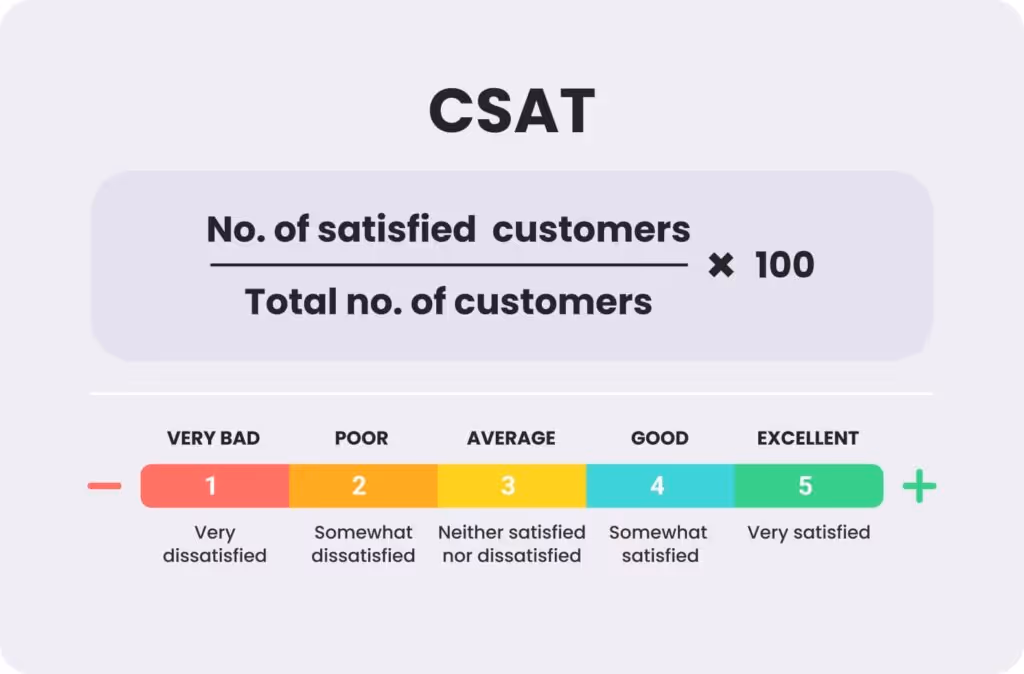
Customer Satisfaction Score (CSAT)
Customer satisfaction score is a fairly straightforward metric used to calculate customer satisfaction with a product, service, or overall experience. It typically involves asking customers to rate their satisfaction on a defined scale, often immediately following a purchase or other customer interaction.
Customer satisfaction surveys are usually concise, asking one or more questions about the customer's satisfaction level. Customer satisfaction surveys can be delivered through various channels, including email, SMS, or directly on a website post-purchase. The key is to make the survey as accessible and non-intrusive as possible to encourage participation and get an idea of genuine customer sentiment.
How to use CSAT data?
Businesses use customer satisfaction scores to pinpoint areas of strength and weakness in their customer experience. By tracking these scores over time, companies can assess the effectiveness of changes made to their products . Data obtained from customer satisfaction scores can also be segmented to understand customer satisfaction levels across different customer groups or product categories.
Repeat purchase rate
This metric measures the percentage of customers who return to make additional purchases. A high repeat purchase rate suggests that customers are satisfied with their initial purchase and have a positive perception of the brand.
To increase the repeat purchase rate, businesses should focus on building strong relationships with customers.
This can be achieved through:
- Personalized communication, such as tailored emails or targeted offers based on past purchases
- Implementing a loyalty program that rewards repeat purchases
- Ensuring consistent quality in products and services
Regular monitoring and analysis can provide insights into which products or services are most likely to drive repeat purchases and identify potential areas for improvement. By understanding these patterns, businesses can tailor their strategies to enhance customer retention and loyalty.
Customer churn rate
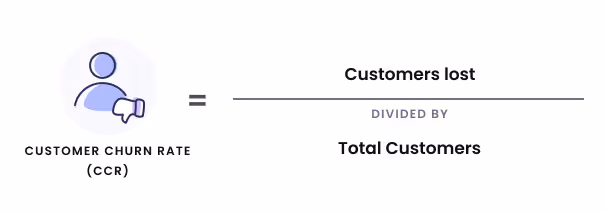
This metric measures the percentage of customers who stop doing business with a company over a specific period. It’s an essential indicator of customer dissatisfaction, loyalty, and the overall effectiveness of retention strategies.
Reducing customer churn rate is crucial for long-term business sustainability, as retaining existing customers is often more cost-effective than acquiring new ones. A lower churn rate typically indicates higher customer satisfaction and loyalty.
To reduce churn, businesses should focus on identifying the reasons behind customer departures and implementing targeted strategies to address these issues.
This may include:
- Improving product quality
- Taking customer service to the next level
- Offering personalized incentives to stay
Customer retention rate
Finally, the customer retention rate measures the percentage of customers a company retains over a specific period. It reflects the effectiveness of customer loyalty and retention strategies.
A higher customer retention rate not only improves revenue but also enhances the brand reputation. Loyal customers are more likely to engage in positive word-of-mouth, contributing to the business's growth and market standing.
Increasing customer retention rate
These are some critical factors that can help you increase the customer retention rate:
- Understanding customer needs
- Enhancing customer service
- Offering loyalty programs
- Consistently providing value to customers
- Personalization
Summary
It is more than obvious that the landscape of customer satisfaction is dynamic, challenging, and multifaceted. By monitoring and improving these top ten metrics for customer satisfaction, businesses can develop a more holistic understanding of their customers and increase customer satisfaction as a result.
This approach is not just about measuring numbers. Rather, measuring customer satisfaction is about building relationships, exceeding expectations, and fostering loyalty in an ever-changing market. As we move forward in 2024 and beyond, these key customer satisfaction metrics will continue to be pivotal in shaping strategies that resonate with customers, improve customer experience, and drive both business and customer success.


.png)