How Noibu's error detection improves time efficiency and streamline workflows

Website errors are a part of having an online presence—whether you like it or not.
With hundreds of news ways to navigate to and around your site (think of all the different devices, IOS and operating system versions, browsers, browser extensions, ad blockers), and the countless number of third-party plugins that go into your ecommerce store, it’s next to impossible to test out every user flow and configuration your website will need to accommodate.
And with unannounced third-party platform updates, browser updates, and payment-gateway changes, your site infrastructure isn’t always going to be prepared to seamlessly handle these new data flows and interactions on the fly. (Learn more about how errors get introduced into your ecommerce environment)
This is probably why, according to a study conducted by consultancy firm Edgar, Dunn & Company, 94% of all (European) ecommerce websites have at least 5 live, customer-impacting errors on their site at all times.
With the help of the Baymard Institute, we also know how expensive of a problem these errors equate to on an industry-scale.
Below is a chart depicting the top 10 reasons US-based consumers abandon their online shopping carts.

You can see that ‘Website Errors’ are listed as the 7th most likely reason for abandonment, sitting at 13%. When paired with the total revenue loss of $493.52 Billion due to abandoned carts projected for the year 2023, website errors are expected to lose businesses $64.2 Billion in a single year.
So we can conclude that website errors are not only happening, but are gravely impacting ecommerce brands’ most important metric: revenue.
But you probably already knew that.
In the case of almost all ecommerce brands, ecomm professionals are already hearing about site errors from their QA department or through their customers. What they’re needing is a better way to identify which ones are the most pressing and a faster way to find a resolution to those errors.
That is what this piece is going to help you with.
*In a rush? Scroll down to the Summary to get the bare-bones statistics that we will be unpacking throughout this blog
How is your team deciding what support tickets or detected site errors to address first?
If you’re exclusively hearing about site errors through your customers and support tickets, you’re really not getting a lot of data to work with. You may be given what url the error happened on, and maybe some information on the action the potential customer was trying to take, but you’re really at the mercy of your customer. You’re not going to know how many people a specific error is affecting, or how it is impacting your conversion numbers.
If you have an Application Performance Monitoring tool in place, you may look to occurrence metrics as a way to determine what errors should be addressed first. More eyes on an issue means more critical, right? Not exactly.
Unfortunately, occurrence data is only an indicator towards the true business metric that matters, which is revenue.
An image that isn’t loading properly for 100+ customers, but isn’t impacting any of those users’ ability to shop and checkout isn’t actually that critical. But a Javascript error causing the Add Shipping Details button to not work for 5 customers that are using Firefox on a tablet, that’s going to be blocking actual dollars from coming in.
So, how do you concretely know what site errors are having meaningful impacts on your bottom line, and how do you do this quickly?
You could gather all your known site errors and individually investigate each one, figure out the symptoms of the error, and what it looks like for your customers. From there you can make some assumptions about the drop in conversion and the resulting loss of revenue. But that isn’t a short process.
With Noibu, you can see all detected errors in one place. But instead of having to spend time investigating and guessing which ones have the most grave impact, everything is already calculated out and prioritized for you. All errors have conversion and revenue impact data automatically calculated and displayed, so your team can quickly decide what needs to be actioned and when, all in a matter of seconds.
Having automatically prioritized errors based on revenue and conversion impact ends up eliminating the time spent on investigative and/or guesswork to pick out errors for development sprints, and ensures that any time that is being spent on error resolution will move the needle in a meaningful, positive direction.
Error resolution is also creating a time-consuming headache for your development team
An interesting study was conducted by the folks at Rollbar, where they asked 950 developers about their relationship with error resolution. The results were quite telling.
“Nearly two-thirds of all developers said they would rather do an unpleasant activity than fix errors. More than a fourth (26%) said they would rather pay bills. More than a fifth (21%) said they would prefer going to the dentist. And 20% would rather spend time with their in-laws.” (BusinessWire)
That’s pretty harsh feedback, right?
While of course those statistics are a bit tongue-in-cheek, the real concerning set of statistics that this study uncovered was the amount of time being sunk into error resolution.
- 32% of developers spend up to 10 hr/wk on fixing bugs
- 16% spend up to 15 hr/wk on fixing bugs
- 6% spent up to 20 hr/wk on fixing bugs
“More than half of developers (55%) said that if they didn’t have to spend so much time fixing bugs, they would have the time to build new features and functionality. 42% of the total survey group said they would be able to do their job if not for the time spent on fixing bugs.” (BusinessWire)
Wow.
This number of hours dedicated to bug resolution lines up with what we’ve seen with prospects as well. Keeping it conservative, the average ecommerce development team dedicates approximately 25% of their sprint time to error resolution.
With 7 hour days (8 hours with an hour for lunch), 5 days in an average work week, and 2 weeks for typical dev sprints, this comes out to around 17.5hrs spent fixing bugs per developer per sprint.
This equates to about 2 and a half full days of development time solely being spent on error resolution. In other words, that’s 2.5 days of innovation and feature work not being worked on. Every single sprint.
Why does this process take so long?
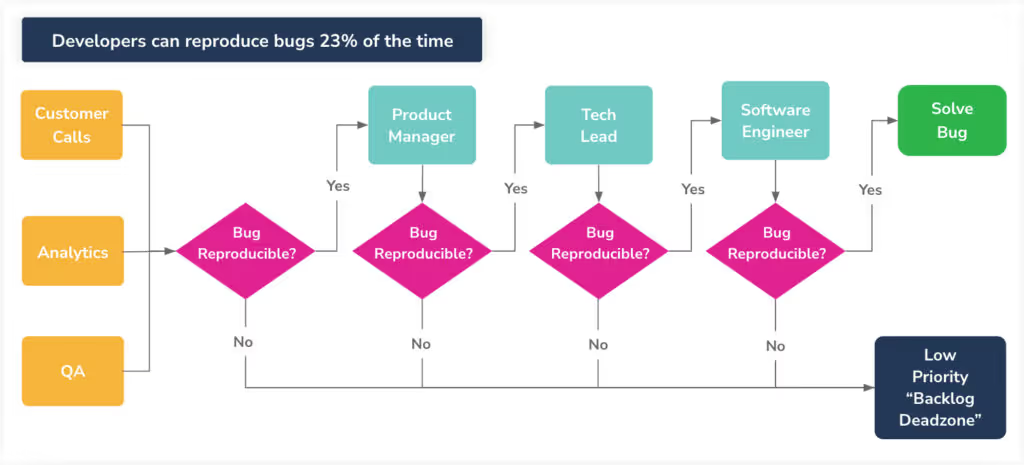
In order to fix a bug, developers need to know where the error is, what actions and circumstances cause the error to occur, what happens when the error occurs (both from a user perspective, and a code perspective), and where to go to apply the fixes.
Traditional error monitoring softwares don’t provide a comprehensive collection of this data, meaning development teams have to go through what they call replication workflows to determine the root cause of an error, and the corrective action that needs to be taken.
The process looks something like this:

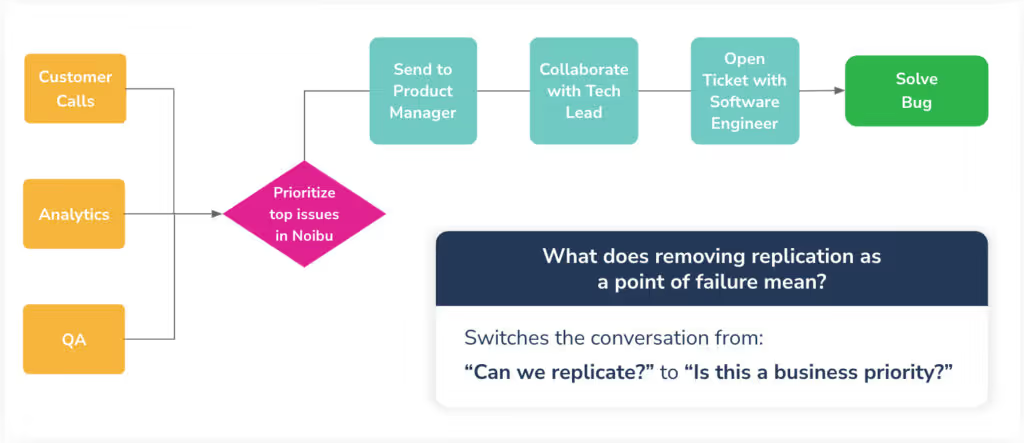
Noibu’s software is unique in that it can provide the data that would previously only be able to be captured by going through these repetitive replication workflows.
With a comprehensive developer tab for every detected site error, and session recordings, the need to spend hours and hours trying to rebuild the error to fix the error can be eliminated… Changing the workflow from what we see above, to this:

With this new, streamlined workflow in place, our customers have noted an average drop in time to resolution by 70%.
Rather than 17.5 hours of every sprint being dedicated to error resolution per developer, the average Noibu-using developer only spends around 4.5 hrs on error resolution.
All this means that Noibu customers can ensure that their critical errors are active for the least amount of time possible, and their developers can get back to doing what they love: developing new code.
The CTO and Director of Engineering also get the added bonus of knowing that the time their team does dedicate to error resolution is guaranteed to move the needle for the business.
Summary
Okay, that was a lot of data thrown your way. Let’s summarize the current state of ecommerce error detection and resolution:
- 13% of all abandoned carts are due to website and checkout errors
- In 2023, it is projected that abandoned carts due to website errors will cause $64.2 Billion in lost revenue for ecommerce brands
- Most ecommerce teams hear about website errors through customer support tickets
- 90% of customers do not take the time to report a site error to the brand
- An average of 25% of a development sprint is spent fixing bugs, translating to approximately 17.5 hours per developer per sprint
- 42% of developers say that being tasked with error resolution stops them from being able to do their job
What the reality could look like with Noibu:
- Confidence that all errors impacting conversion and revenue are immediately detected, reported, and surfaced to relevant teams
- No more reliance on customers to act as your quality assurance team
- Immediate knowledge of most pressing errors (errors are automatically prioritized based on business metrics)
- 70% developer time reduction due to availability of data and the streamlining of resolution workflows
Time reduction isn’t the only benefit to adopting a data-driven approach to error monitoring. See how top online retailers such as Guess saw a 6% increase in conversions, how brands Joe Browns and Ruroc both achieved an over 40x ROI, how furniture brand Mitchell Gold + Bob Williams saved nearly $1 million in revenue, and more by heading to our collection of case studies.


