Unlocking ecommerce success: A comprehensive guide to the data you should track


The old saying that applies to almost everything we do in life goes something like this—if you don't know where you are, you can't know where you're going. And you can’t know where you are, nor where you’re going, if you fail to regularly monitor and assess the things that are truly important for you and your growth.
When it comes to managing and scaling your eCommerce company to unlock its full potential, we at Noibu find that this saying rings particularly true. The mere success of your ecommerce operations relies on the data you gather and the ecommerce metrics you measure. In fact, the most successful ecommerce enterprises like Amazon, eBay US, Alibaba, and others that are constantly winning at ecommerce, are doing so because they're absolutely obsessed with their ecommerce metrics.
For example, Jeff Bezos’s Amazon utilizes big data to improve one of their essential ecommerce metrics—average order value. Amazon sets its product prices in accordance with current activity on its website, product availability, order history, item preferences, foreseen profit margin, and other factors. Then, they utilize the so-called “dynamic pricing” method, which involves changing the prices on given items as big data is updated and analyzed. Thanks to this, Amazon typically earns more significant profits on their best-selling items and offers discounts to the less popular ones. According to a report, this strategy benefited the ecommerce giant by enhancing its annual income by 143% from 2016 to 2019.
Knowing the ins and outs of your key ecommerce metrics and analytics is crucial because it's the only way to gauge your levels of success and identify critical areas for improvement. In the words of the late Peter Drucker—one of the most widely-known and respected influential thinkers on management—if you can't measure it, you can't improve it. In that context, knowing the data you should gather and the key metrics for ecommerce you should measure can definitely help you make better-informed decisions to achieve your business objectives.
In this comprehensive article, we'll dive into the essential data ecommerce product managers and ecommerce teams should track in order to grow strong and profitable brands.
The ecommerce metrics you should track to take your ecommerce business to the next level
In a nutshell, eCommerce metrics can be defined as any measurable, consistent method to assess achieving a given ecommerce website's goal. However, while there are many ecommerce metrics to monitor, it is unnecessary to monitor the indicators that do not significantly impact the financial performance of your ecommerce business.
For that reason, it’s far more practical to focus on a limited number of ecommerce metrics that have the most significant influence on your ecommerce business and use them as key performance indicators (KPIs).
KPIs stand for key performance indicators, and they should be the primary focus when tracking any kind of progress, even though all metrics are essential for monitoring. The most significant difference between ecommerce metrics and KPIs is that metrics measure and quantify processes, while KPIs assess the effectiveness of those processes in achieving the desired outcomes.
Below, we have compiled a list of the most important metrics that SMB, MM, and enterprise ecommerce teams should consider tracking to improve and optimize their company's processes. As you review the following metrics, it is vital to keep your business objectives in mind to identify those relevant to your business.
Conversion rate
Monitoring the sales conversion rate is a critical metric for ecommerce businesses. This rate represents the percentage of website visitors who make a purchase, and it's important to maximize it as much as possible.
For instance, if 200,000 people visited your online shop this week and only 1,000 made a purchase, your conversion rate would be 0.5%. However, conversion rates vary greatly depending on the industry and product category.
In March 2023, the average conversion rate across ecommerce businesses was 1.75%, a slight increase from March 2022, at 1.66%. Wellness and health products had the highest conversion rate at 4.2%, followed by crafts at 4.07% and household and kitchen appliances at 3%.
For that reason, it would be best to research your industry and target market to determine a good benchmark for your online store's performance. Nevertheless, some things that you can do in order to grow your ecommerce conversion rate include:
- Enhance your product pages load rates;
- Use only high-resolution professional photographs and videos of the products you sell;
- Optimize your listings by using well-researched keywords;
- Set a different conversion rate for every selling platform that you use;
- Set conversion rates for every product category because some may have better conversion rates than others;
- Set a conversion rate for each promotion, such as when dealing with influencers or affiliates.
All in all, it's essential to maintain or improve your conversion rate over time. If you notice a significant decrease in traffic, it could point to an issue with your website that needs to be addressed.
At Noibu, we excel at just that! Noibu is a software solution designed to help ecommerce businesses quickly identify and resolve website issues that interfere with the customer experience and find their correlation with conversion rates.
Integrating with all popular ecommerce platforms like Shopify, Magento, BigCommerce, and others, Noibu is equipped to track website errors across different selling platforms in real-time, thus allowing ecommerce enterprises to identify and address issues before they significantly impact their sales and revenue.
This way, by catching all new website errors and maintaining functional and healthy ecommerce websites, Noibu actively helps ecommerce teams stay focused on the future of their business rather than consistently worrying about the state of their website and achieving long-term success.
Average Order Value (AOV)
It goes without saying that one of the top objectives for any ecommerce shop is to maximize customer spending as much as possible. So, here comes the second ecommerce metric that ecommerce teams should track—the average cost of each purchase in their shop, which represents the average order value.
To estimate your ecommerce store's AOV, divide the total revenue by the number of orders. Measuring the AOV can provide deeper insights into the customers' purchasing power and help identify growth opportunities. It will also help establish clear sales goals and identify what changes ecommerce teams should make so that their customers will willingly spend more with every new transaction.
To increase the average order value, ecommerce teams could utilize the following strategies for enhancing their AOV:
- Offering supplementary goods and items that enhance or extend the functionality of the item the customers originally intended to buy;
- Offer items or services as a bundle or a package so clients get a discount on every item compared to when they purchase them individually;
- Offer free shipping on orders over a certain amount to encourage their customers to spend the most possible.
In addition to these strategies, ecommerce must regularly measure their AOV over time and change their business model, pricing, and product quality as needed to improve their marketing effectiveness and drive more revenue. By taking a data-driven approach to their AOV, ecommerce companies can make smart decisions to help their business thrive.
Customer Lifetime Value (CLV)
The customer lifetime value (CLV) is a significant metric used to calculate the estimated total amount a customer is foreseen to spend on an ecommerce website during their entire relationship with the brand.
For ecommerce businesses, CLV is a crucial factor since it forecasts the future value that each customer will bring to the company. By understanding the CLV, ecommerce teams can make informed decisions about customer acquisition, engagement, and retention strategies.
For instance, if a customer's CLV is high, investing more in marketing and customer service may be worthwhile to keep them engaged and retained. However, a customer with a low CLV may not justify the same level of investment.
By closely monitoring and optimizing their customers' CLV, ecommerce teams can enhance their customer relationships and achieve sustainable growth in the long term. In essence, CLV acts as a crystal ball that enables companies to predict the potential value of a customer to their business.
Customer Acquisition Cost (CAC)
Next in line, among the essential ecommerce metrics that ecommerce teams should track is the so-called customer acquisition cost. By identifying this key metric, ecommerce companies can figure out how much it typically costs to lure in a new customer to their business.
This metric can be calculated using the formula: CAC = total ecommerce marketing and sales costs divided by the number of new clients acquired. For instance, suppose you spend $30,000 on a social media advertising campaign, which results in 4,500 website purchases. In that case, the cost per acquisition for that campaign is $30,000 divided by 4,500, or $6.6.
Ecommerce teams should keep a tab on this valuable metric and ensure it remains reasonable within their CLV expectations. For example, if your CLV is at $500 and your AOV is $450, your customer acquisition cost practically outweighs your profits.
In order to lower your customer acquisition costs, there are a few tactics your ought to try:
- Boosting your conversion rate means that your CAC is going in the opposite direction;
- Cutting down on expenses tied to marketing for client acquisition;
- Engaging in organic and long-term marketing techniques like social media and SEO;
- Spending more money on referral marketing so that your satisfied clients recommend your ecommerce shop to others for free.
Shopping cart abandonment rate
When a prospective buyer begins a purchase but doesn’t go through with it, the process leads to abandoned shopping carts. And since you’re a seasoned ecommerce professional, you know that some customers select to withhold from purchasing even if your products are in great demand and your conversion rate is exceptionally high.
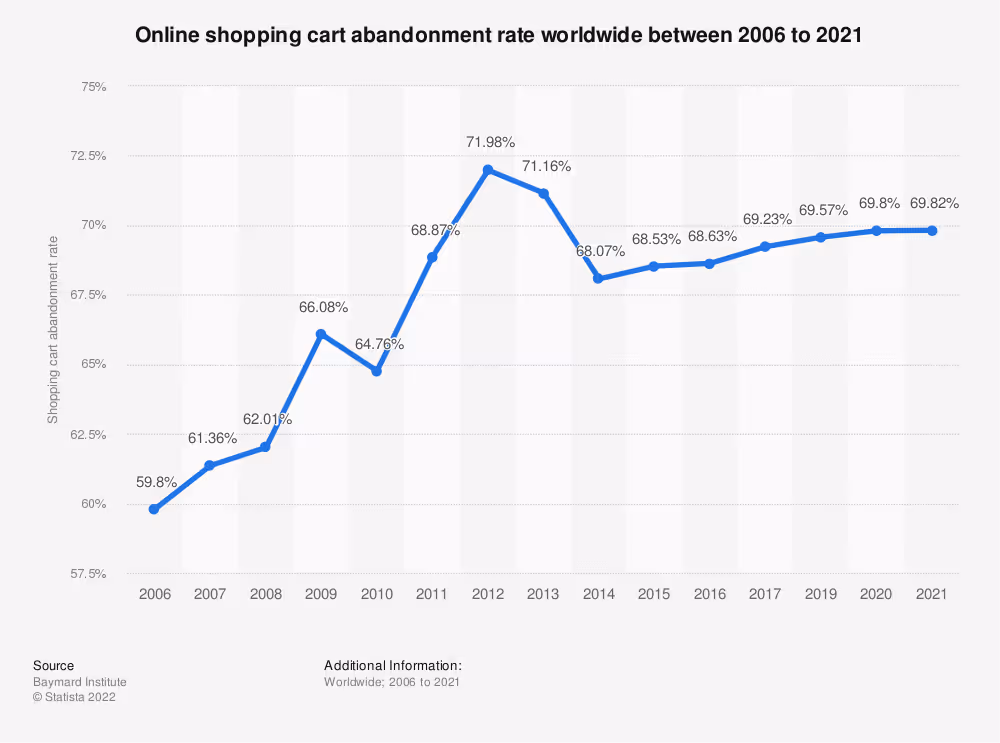
Nonetheless, while this scenario is unfavorable for any ecommerce business, it’s also to be expected. Therefore, monitoring the rate and why potential clients abandon their shopping carts before making the final purchase is an essential ecommerce metric to track and a vital sign of checkout (in)efficiency.
As of March 2023, the calculated data from 48 studies suggest that the average shopping cart abandonment rate is 69.99%. Put differently, this indicates that seven out of ten customers will click out of the ecommerce website without making a final purchase.
In that regard, if you feel like your company can do better when it comes to the shopping cart abandonment rate, here are a few strategies you could try to improve your numbers:
- You can work with your development team to make it more straightforward for shoppers to finalize their purchases by streamlining the entire shopping cart/checkout experience;
- Start using retargeting to persuade wavering clients to come and purchase again from your business. For instance, you can do this by sending out follow-up emails or using tailored advertisements;
- You can provide guest checkout so that clients can buy without creating an account.
When it comes to improving your shopping and checkout abandonment rates, Noibu is the perfect ecommerce monitoring solution that identifies technical issues in these crucial parts of the customer journey.
In 2022, the total ecommerce revenue lost due to cart abandonment was projected to be north of $443 billion. 13% of those $443 billion is expected to be caused by website bugs, errors, and shopping cart malfunctions.
Noibu helps ecommerce teams monitor add-to-cart functionalities, diagnose all potential checkout errors, and get notified when an error or a bug arises in this part of the online funnel to prevent lost sales.
To put it in a numbers perspective, Noibu practically services a $53 billion problem globally, which speaks volumes about why SMB, MM, and enterprise ecommerce companies are eager to implement an error detection solution like Noibu.
Email opt-in rate
Although social media has become an essential aspect of digital marketing, email marketing remains a crucial tool for ecommerce companies. Email marketing is still handy for encouraging repeat purchases and remarketing products to potential customers.
Like with website traffic, the aim is to experience a rise in the number of email subscribers, even when they don't make a purchase immediately. While website visitors may be intrigued by your products or services, those who subscribe to your newsletter have a vested interest in your company and its future, which means that they're more likely to convert into loyal and paying customers soon.
To encourage people to subscribe to your emails, offer them something valuable in return for their email addresses and other personal contact information. For instance, consider offering your new subscribers an exclusive discount on their first or next purchase through a code or voucher.
Additionally, providing a customer-friendly positive email communication experience (such as understanding your brand and being steady in messaging) along with a simple registration process and effective calls to action can increase subscription rates.
It's crucial to keep the rate of unsubscribes to a minimum. Though unsubscribers are inevitable, you should aim to keep the number to less than 0.5%. If many people are unsubscribing themselves from your email list, it's time to reevaluate your strategy.
Cost of Goods Sold (COGS)
Establishing the right price can be tricky, even for experienced online sellers with solid educational backgrounds. However, it's critical to determine a pricing strategy that generates profits while being competitive enough to foster repeat business from your existing customers.
When evaluating the appropriate price point, it's crucial to account for several variables that may be concealed, such as product demand, competition, perceived value, and customer expectations. However, the most critical factor to have in mind when determining the price of your goods or services is your cost of goods sold (COGS).
COGS measures the direct costs associated with producing your goods, also known as the "cost of sales." By calculating your COGS accurately, you can estimate the minimum amount you'll need to charge to cover your expenses and make a profit. It's critical to ensure that your price is high enough to cover your costs while being competitive enough to remain attractive to potential customers.
For a clothing manufacturer and retailer, the cost of goods typically includes the expenses for fabric, buttons, thread, labels, equipment, machinery, and personnel directly involved in production and manufacturing.
Accurate COGS data can help you determine your products' correct pricing and profitability. In essence, you must know how much your company spends on the products you carry to determine the appropriate pricing and how much revenue you generate.
Moreover, knowing the COGS can guide you in promoting the best products based on their profit margins. For instance, a long-sleeved blouse with an 18% profit margin could be an excellent candidate for a small-scale yet scalable email marketing campaign. In comparison, a high-end designer pair of shoes with a 65% margin might benefit more from expensive marketing methods like social media advertising or PPC marketing.
Final thoughts
In the end, monitoring the key metrics for ecommerce is critical for the success and growth of your online business, and there's no way around it. These metrics provide insight into customer behavior, marketing efficiency, operational efficiency, and financial performance.
By regularly tracking and analyzing these metrics, ecommerce businesses can make informed decisions to improve their operations, increase customer satisfaction, and drive growth. From measuring your conversion rates and bounce rates to knowing your customer lifetime value and customer acquisition cost, each metric provides a unique perspective on the performance of your ecommerce business.
A comprehensive understanding of these metrics will help you identify areas for improvement, optimize your operations, and achieve your business goals by providing you with a big picture of where your ecommerce operation is and where it should be headed.
.png)